Historically, there has been a lack of automated tools to quantify & reason about architecture. This page describes some of the methods developed by Baldwin & MacCormack to explore the structure of large codebases. More details can be found in ‘Hidden Structure: Using Network Methods to Map System Architecture”.
Measuring Architectural Complexity in Software
Well-known patterns are employed by man and nature to control complexity as systems scale. These include hierarchy and modularity. Technical architectures in which these patterns are judiciously applied tend to be of higher quality, be safer, and to benefit from other capabilities over the course of their lifecycles.
There are certainly well designed systems that are integral where these patterns may be less pronounced. Integral systems are more architecturally complex than comparably sized systems with hierarchical structure or modular boundaries, and that architectural complexity may also make them more costly. Within the same system, different regions will be more interconnected or less so, and will therefore have varying levels of intra-system architectural complexity.
Components in a position to affect many other components, or that can be affected by many other components, have high levels of architectural complexity relative to their less well-connected peers. Affecting or being affected by other components need not be direct – it may be done through an intermediate connection. Architectural patterns are global features of a design. To capture the impact that these architectural patterns have on a single component you must use metrics that take both direct and indirect relationships into account.
Networks are established tools for representing and analyzing system architectures because they are a natural means of capturing hierarchical relationships, modularity, coupling, cohesion, and cyclicality, and other architecturally important patterns. When networks are used for this purpose, network nodes designate parts, components, or system elements. Arcs or lines between nodes designate functional or structural relationships between those parts. If these arcs are directed they can represent one-way dependencies between parts. Directed networks are appropriate abstractions for use in this study because they can be used to represent relationships between software constructs that are often unidirectional.
Networks and DSM Architecture Representations
A network is a means of representing entities and the paths or relationships between them. In network terminology, an entity is a “node” while a path or relationship is an “edge” or “arc.” The following figures show the same simple network in two different ways.
- Figure 1 is a traditional network view. Nodes A, B, and C, are connected by the arc and the bi-directional arc .
- Figure 2 shows this same network as a square matrix. Nodes have the same ordering down columns and across rows. Dots in the matrix serve the same purpose as arrows in the traditional view. A directed arc is read by looking first at a row (the “from” dimension”), finding a blue dot indicating an arc, and then scanning up the column to see which node the arc goes “to.”
In the traditional representation, each node is a single point. In the DSM representation, each arc is a single point. While encoding identical information, each view can highlight different network features.
 Figure 1: Simple Network Figure 1: Simple Network |
 Figure 2: Simple DSM Figure 2: Simple DSM |
Real-World Networks
Two real-world networks illustrate the value of both traditional and DSM network notations. The Moscow Subway map shown in Figure 3 (a traditional view) can be used in navigation. A matrix representation would not allow a person to reach a destination. On the other hand, the matrix representation of the Mozilla software system (shown in Figure 4) can be used to highlight the modularity and coupling patterns in the system. A traditional view would not make these properties visible.
 Figure 3: Moscow Subway Map Figure 3: Moscow Subway Map |
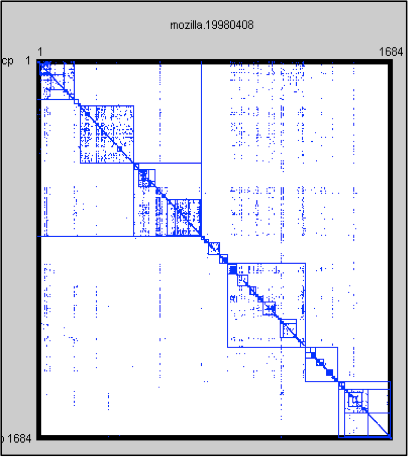 Figure 4: Mozilla DSM Figure 4: Mozilla DSM |
Assigning Architectural Complexity Scores to Source Code Files
Using network metrics that capture the level of coupling between each software file and the rest of the system, you can operationalize the concept of architectural complexity, and therefore represent the relative absence of modular isolation or hierarchical structure in a design. The approach can be described in the following steps:
- Capture a network representation of a software product’s source-code using dependency extraction tools
- Find all the indirect paths between files in the network by computing the graph’s transitive closure
- Assign two visibility scores to each file that represent its reachability from other files or ability to reach other files in the network
- Use these two visibility scores to classify each file as one of four types: peripheral, utility, control, or core.
Extracting DSMs From a Software Codebase
Software developers can create and modify systems consisting of thousands of source code files and many millions of lines of code. Each source code file contains text written in a specific programming language. These files typically specify functions a computer should perform and data structures for those functions to operate on. Functions tell a computer’s processor what instructions to perform while the data structures define information that will be stored in a computer’s memory. Similar functionality is often grouped inside the same source code file, but some files will depend on functionality or data described in other files. When software development is complete, all of the files must be compiled and linked together. Each file is translated into a machine-readable form, and cross-references between files are resolved. Once this linking step is complete, a program can be loaded and run. In a DSM, software source-code files are represented as nodes. When a relationship (such as the invocation of functionality or data access) spans two files, it is represented as an arc between two nodes. Figure 5 is a very simple illustration containing a program with two files, each containing two procedures. The first file defines procedures for calculating properties of a rectangle. The second defines generic mathematical procedures that multiply and add numbers. Calls from the “rectangle” functions to the “math” functions span these two files. This example would result in a network with two nodes, and a single arc from “rectangle_functions” to “math_functions.”
 Figure 6: Hierarchical Software System Figure 6: Hierarchical Software System |
 Figure 7: “Core-Periphery” Software System Figure 7: “Core-Periphery” Software System |
Finding the Indirect Dependencies in a Graph
Once a network of the software architecture is captured, a transitive closure algorithm must be run to identify all direct and indirect links. The figures below illustrate how this is done. Figure 8 and Figure 9 are network and DSM representations of the same graph. Figure 10 and Figure 11 are the transitive closures diagrams of that same graph. Note that node “D” depends on “C” directly, and “A” and “B” indirectly. The transitive closure graph shows potential dependencies in the system. The indirect link from D to A is important because an unwise design change made to A could break D through the intermediary C. Unintended side-effects of design choices may be conveyed through intermediaries because indirect links are harder for the designer to track.
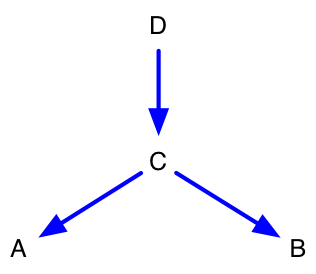 Figure 8: Simple Network (Direct) Figure 8: Simple Network (Direct) |
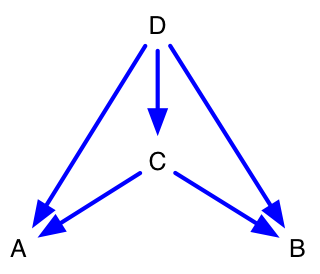 Figure 10: Simple Network (Transitive Closure) Figure 10: Simple Network (Transitive Closure) |
 Figure 9: Simple DSM (Direct) Figure 9: Simple DSM (Direct) |
 Figure 11: Simple DSM (Transitive Closure) Figure 11: Simple DSM (Transitive Closure) |
Computing visibility metrics for each file
Once the transitive closure graph is computed, visibility scores are computed for each node. The following metrics are taken for each node in the direct dependency DSM:
- Fan In (FI): How many other nodes depend upon it directly?Computed by counting the number of arrows pointing into that node or counting entries (including the diagonal square) down the node’s column in the DSM.
- Fan Out (FO): How many other nodes does it depend upon directly? Computed by counting the number of arrows pointing out from that node or counting entries (including the diagonal square) across the node’s row in the DSM.
The following metrics are taken for each component from the transitive closure DSM and its nodes:
- Visibility Fan In (VFI): How many other nodes depend upon it directly or indirectly? Computed by counting the number of arrows pointing into that node in the transitive closure graph or counting entries (including the diagonal square) down the node’s column in the DSM.
- Visibility Fan Out (VFO): How many other nodes does it depend upon directly or indirectly? Computed by counting the number of arrows pointing out from that node in the transitive closure graph or counting entries (including the diagonal square) across the node’s row in the DSM.
The following metrics are taken for the system as a whole:
- Network Density: A system-wide metric determined by dividing the number of direct links in the graph by the total number of possible links. Computed by counting the number of dots and diagonal elements and dividing by the total number of squares.
- Propagation Cost: A system-wide metric determined by dividing the number of direct and indirect links in the graph by the total number of possible links. Computed by counting the number of dots and diagonal elements and dividing by the total number of squares.
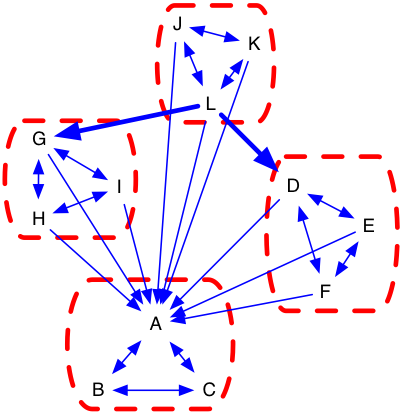
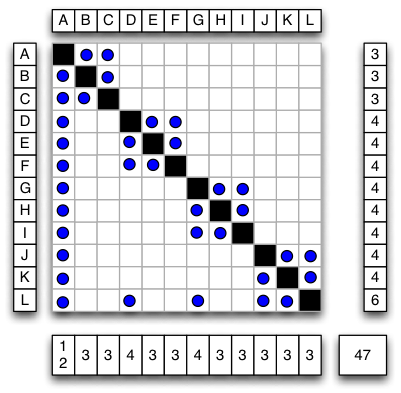
To illustrate, Figure 12 and Figure 14 represent the same network with 12 nodes and 47 arcs (including self referencing arcs), while Figure 16 is its transitive closure. In these examples, node “H” has FI = 3, FO = 4, VFI = 6, and VFO = 6. For the system as a whole, Network density = 47/144 and Propagation cost = 81/144.
Component Architectural Categories: Peripheral, Utility, Control, Core
Once computed, VFI and VFO scores for components across a system can be rank-ordered and plotted to see their distributions. Figure 18 shows the distribution of visibility scores for one release. When systems have a core-periphery structure, these distributions tend to contain “cliffs” demarcating the boundary between peripheral files and those that are highly connected when indirect links are considered. These cliffs are used to partition VFI and VFO scores into “low” or “high” bins.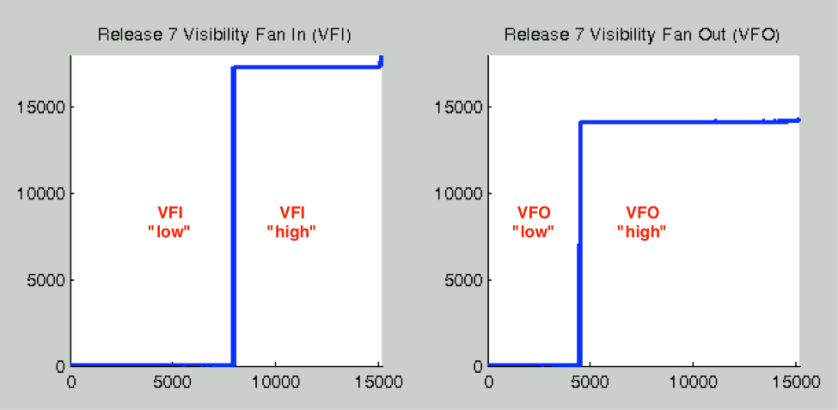 Figure 18: Distribution of Visibility Scores and Cutoff Points for a “Core Periphery” Network
Once visibility scores have been computed, and once those scores are classified as either “high” or “low”, each component can be classified as peripheral, utility, control, or core according to the scheme laid out in Table 1.
| If VFI is | and VFO is | then it is | Description |
| low | low | peripheral | Peripheral components do not influence and are not influenced by much of the rest of the system. |
| high | low | utility | Utility components are relied upon (directly or indirectly) by a large portion of the system but do not depend upon many other components themselves. They have the potential to be self-contained and stable. |
| low | high | control | Control components invoke the functionality or accesses the data of many other nodes. It may coordinate their collective behavior so as to bring about the system level function. |
| high | high | core | Core regions of the system form highly integral clusters, often containing large cycles in which components are directly or indirectly co-dependent. These regions are hard to decompose into smaller parts and may be unmanageable if they become too large. |
Table 1: Mapping of Visibility Scores to Architectural Complexity Classification
This example uses each file’s classification as peripheral, utility, control, or core as an indicator of the file’s architectural complexity. Core files are the most architecturally complex because their high levels of connectedness indicate that they are in regions of the network that are coupled by large architecture spanning cycles.
How Visibility Metrics Capture Architectural Complexity
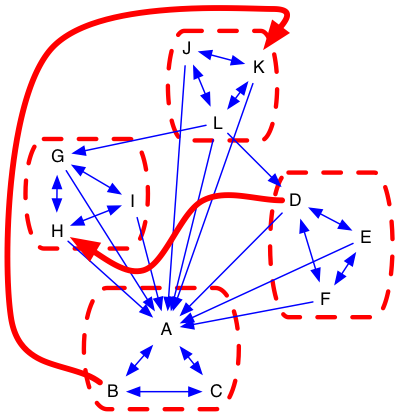
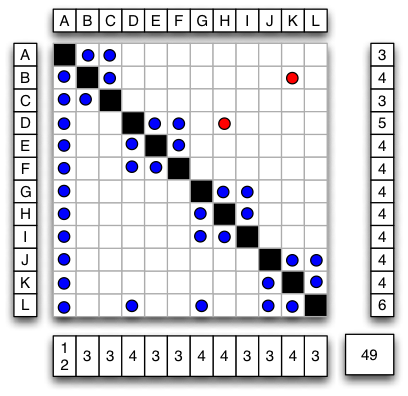
Figure 12, Figure 14, and Figure 16 show a system structured as a hierarchy composed of modules. In order to understand how these architectural patterns manage complexity and how MacCormack’s visibility metrics capture this fact, we will explore a degenerate case represented by Figure 13, Figure 15, and Figure 17. Imagine that during maintenance, engineers inadvertently added two additional links ( and ) in violation of design rules. The network density rises slightly from (47/144) or 33% to (49/144) or 34%. causes multiple issues. First, D is interacting with a node that was not previously considered “public” by its module. Secondly, couples two modules that previously had no interaction. These modules can no longer co-evolve independently. Teams developing the separate modules may not be aware of this fact. It is possible that H’s owner is unaware that D is now dependent upon it. is more problematic. It introduces a long cycle spanning several independent components. Not only does B directly depend upon K, K also indirectly depends upon B. Any functionality that indirectly depends on B (potentially all of it) now has a chance of getting into a recursive loop of dependence. Modular isolation of the system has broken down. Hierarchy has been eliminated because arrows no longer flow in one direction. Homeostasis has been eliminated. This fact is captured in transitive closure DSM shown in Figure 18. In the degenerate system, VFI and VFO for all nodes are now at a maximum. Propagation cost of this system has risen from (81/144) or 56% to (144/144), 100%.
How Hierarchy and Modularity Control Architectural Complexity
Hierarchy and modularity are tools that can control complexity. When these patterns are employed judiciously, a system can scale, side effects can be avoided, independent parts can co-evolve, and the development process can be managed by fallible and boundedly-rational human actors. Networks connected in these ways are far from random – rather, they are highly indicative of intentional or evolved order in a system. To demonstrate this point, imagine that 10,000 random DSMs with 12 nodes and 47 arcs (12 on the diagonal) were generated. These DSMs have the same number of nodes and arcs as the network in Figure 12. After generation, the transitive closure of each random graph was computed. The propagation cost for the random networks was compared against the propagation cost for network in Figure 12. Table 2 contains the results.
| Network density | Propagation cost | |
| Hierarchy of Modules | 32.64% | 56.25% |
| Hierarchy of Modules (broken) | 34.03% | 100.00% |
| Random network MIN | 32.64% | 51.39% |
| Random network MAX | 32.64% | 100.00% |
| Random network Mean | 32.64% | 93.84% |
| Random network Median | 32.64% | 92.36% |
| Random network Mode | 32.64% | 100.00% |
Table 2: Propagation Cost of Structured and Random Networks
Note that the average propagation cost for random networks is above 90 percent, while the propagation cost for the hierarchy of modules was very close to the minimum of the 10,000 randomly generated networks. Lower-diagonalizing and visually inspecting 50 randomly generated networks with low propagation cost (those with scores below 60%) shows that lowest scoring architectures were almost fully hierarchical while those with only one or two small cores had these low scores as well. Hierarchy and modularity seem to control structural complexity, and this fact is captured by MacCormack’s visibility metrics. It should be noted that MacCormack’s classification scheme defines categories that only imperfectly capture some aspects of hierarchy and modularity. By definition, hierarchies are directed acyclic graphs. By identifying the largest system-spanning cycle and defining nodes captured that cycle it as “core,” we identify a set of files that are clearly in a-hierarchical regions of the system. Some non-core files are also positioned within network-cycles, but those cycles tend to be localized rather than system spanning. Localized cycles can constitute modules that, so long as they are reasonably sized, manage complexity by isolating integrated functionality. MacCormack’s classification scheme also captures some notions of modularity by differentiating between files that are tightly coupled and loosely coupled. Loosely coupled elements are easier to evolve and have greater “option-value.” By employing a single metrics that imperfectly captures some aspects of both hierarchy and modularity, we can operationalize the concept of architectural complexity in a simple (if somewhat crude) manner. If the simple architectural complexity metrics employed in this study found to be important, subsequent work should explore the link between quality, productivity, and other more specialized architectural measures.
Software Design Structure
Measures of software complexity focus on capturing the number of elements in a design, while measures of software modularity focus on the patterns of dependencies between these elements. A product can be both complex (i.e., have many parts) and modular (i.e., have few dependencies between these parts).
The measurement of modularity has gained significant traction in the field of software, given the information-based nature of the product lends itself to analytical techniques that are not possible with physical products. Critically, software systems are rarely re-built from scratch but instead use the prior version as a base upon which new functionality is added. This dynamic increases the importance of understanding techniques by which the resulting complexity can be managed.
The formal study of software modularity began with the concept of “information hiding” as a mechanism for dividing code into modular units. Later, metrics were proposed to capture the level of “coupling” between modules and “cohesion” within modules, used to measure product complexity for the purposes of predicting development productivity and quality.
Software Modularity Measurement
Efforts to measure software modularity generally follow one of two approaches:
- Analyzing specific types of dependency between components, for example, the number of non-local branching statements; the number of global variables ; or the number of function calls.
- Inferring the presence of a dependency between components by assessing whether they tend to be modified at the same time.
While the latter measurement approach avoids the need to specify the type of dependency between components, it requires access to maintenance data that is not always available, or captured consistently across projects. In multi-project comparisons, a method that extracts dependencies from the source code itself is preferred.
With the rise in popularity of open-source software, interest in the topic of modularity has received further attention. Some argue that open source software is inherently more modular than proprietary software. Others suggest that modularity is a required property for this method to succeed.
Some criticize the number of problematic dependencies between components in systems such as Linux. Others provide quantitative and qualitative data that open source products are easier to modify or have fewer dependencies between their constituent elements. However, no one has done an apples-to-apples comparison using products that fulfill the same function but that have been developed within different types of organization.
Building a DSM
There are two choices to make when applying DSMs to a software product: The unit of analysis and the type of dependency.
There are several levels at which a DSM can be built: the directory level, which corresponds to a group of source files that pertain to a specific subsystem; the source file level, which corresponds to a collection of related processes and functions; and the function level, which corresponds to a set of instructions that perform a specific task.
There are several reasons to analyze designs at the source file level:
- Source files tend to contain functions with a similar focus.
- Tasks and responsibilities are allocated to programmers at the source file level, allowing them to maintain control over all the functions that perform related tasks.
- Software development tools use the source file as the unit of analysis for version control.
- Prior work on design uses the source file as the primary level of analysis.
There are many types of dependency between source files in a software product. One important dependency type is the “Function Call.” A Function Call is an instruction that requests a specific task to be executed. The function called may or may not be located within the source file originating the request. When it is not, this creates a dependency between two source files, in a specific direction.
For example, if FunctionA in SourceFile1 calls FunctionB in SourceFile2, then we note that SourceFile1 depends upon (or “uses”) SourceFile2. This dependency is marked in location (1, 2) in the DSM. Note this does not imply that SourceFile2 depends upon SourceFile1; the dependency is not symmetric unless SourceFile2 also calls a function in SourceFile1.
To capture function calls, input a product’s source code into a tool called a “Call Graph Extractor.” This tool is used to obtain a better understanding
of system structure and interactions between parts of the design.
The DSM of a software product can be displayed using the Architectural View. This groups each source file into a series of nested clusters defined by the directory structure, with boxes drawn around each successive layer in the hierarchy. The result is a map of dependencies, organized by the programmer’s perception of the design.
The technique of matrix multiplication can be used to identify the “visibility” of an element for any given path length. By raising the dependency
matrix to successive powers of n, the results show the direct and indirect dependencies that exist for successive path lengths of n. By summing these matrices together you can derive the visibility matrix V, showing the dependencies that exist between all system elements for all possible path lengths up to the maximum – governed by the size of the DSM itself.
To summarize this data for the system as a whole, compute the density of the visibility matrix, which can be thought of as the system’s Propagation Cost. Intuitively, this metric captures measures the percentage of system elements that can be affected, on average, when a change is made to a randomly chosen element.
Structural Complexity Metrics
In addition to syntactical metrics, a number of lesser-used structural metrics exist, some of which relate to levels of coupling and cohesion. Two metrics of note are “fan-in” and “fan-out,” which are measures of the direct structural connectivity between components.
- Fan-in counts the number of components that depend upon a component.
- Fan-out counts the number of components that are depended upon by a component.
When looking at the degree distributions of software networks, software dependency networks have “small world” characteristics and are “scale-free” (obeying a Power-law distribution) for nodal in-degree (but not out-degree). Fan-out correlates with defects (because it is a measure of the number of upstream components) but suggesting that Fan-in does not.
MacCormack, Baldwin, and Rusnak have devised a procedure for classifying software components (such as files) based on their level of direct and indirect coupling with the rest of a software system. Their directed-network-based classification scheme identifies “core” nodes – those that are contained within the largest network cycle.
This classification scheme can differentiate between software source code files whose interactions with the rest of the system are mediated through hierarchical or modular constructs and those that are more tightly coupled to disparate parts of the system.
Design Structure Matrix Methods for Complex Systems
The Design Structure Matrix (DSM) is a square matrix network representation of project dependencies and coupling in a product architecture. DSMs are helpful network modeling tools used to represent the elements comprising a system and their interactions, highlighting the system’s architecture. Unlike typical pictures of networks, DSMs allow engineers to see the topography and density of interconnections in and between different parts of a system. They provide simple, compact, and visual representations of complex systems that support innovative solutions to software problems.
The DSM community was not the first to use matrix-based representations of technical networks. The DSM community has, however, pioneered the application of square matrices as a practical tool in large-scale systems analysis, engineering design, and project management. The advantages of DSMs versus alternative system representation and analysis techniques have led to their increasing use in a variety of contexts, including product development, project planning, project management, systems engineering, and organization design.
Nodes and Arcs
DSMs represent project tasks or system elements as network nodes and represent task dependencies or coupling between parts as arcs. Nodes are represented as an ordered list of length N. Arcs are stored in a square matrix with size <N, N>. An arc is added to the network by inserting an entry at a point , thereby creating an association between two nodes in the ordered list. This representation makes certain features visible that cannot be seen in a traditional “node and arc” view.
The DSM of a laptop shown below does three things. The figure:
- highlights the interconnections between different parts;
- shows how those parts are clustered into modules; and
- points out circular interactions between parts in different modules that should ideally prompt cross-team coordination.

